Google Classroom
GeoGebra
GeoGebra Classroom
Sign in
Search
Google Classroom
GeoGebra
GeoGebra Classroom
Outline
Statistics
Box Plot
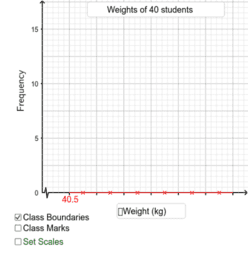
Drawing Histograms
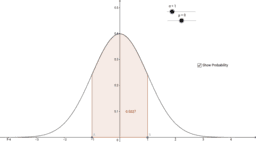
Altering the standard deviation and mean of the normal curve
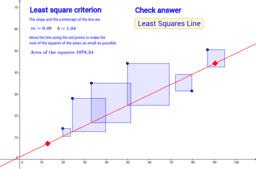
Least Squares Criterion
Statistics
Author:
Dr. Edgar
Box Plot
Drawing Histograms
Altering the standard deviation and mean of the normal curve
Least Squares Criterion
Next
Box Plot
New Resources
alg2_05_05_01_slider_practice_flvs
探究由平行線和截線所成的角
Explore the invariant lines of matrix {{-2,5},{6,-9}}
Exploring the Derivative of an Exponential Function
Construct a Conic
Discover Resources
Cone and Cylinder Volume
sinthetaovertheta
TS.3 Dilations Create Similar Figures #6
Project
Modul 4B_Diah Vialita Dewi_SMKN 1 Banyuanyar
Discover Topics
Quadratic Functions
Arithmetic Operations
Cone
Power Functions
Orthocenter