Google Classroom
GeoGebra
GeoGebra Classroom
Sign in
Search
Google Classroom
GeoGebra
GeoGebra Classroom
Outline
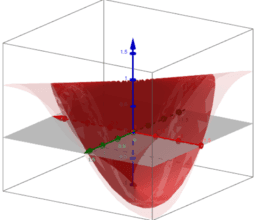
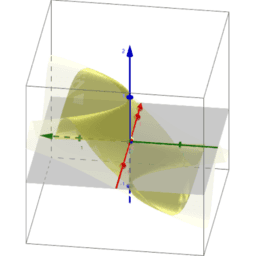
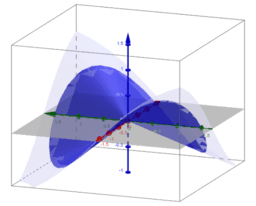
Visualization of limits of functions of two variables
Introduction
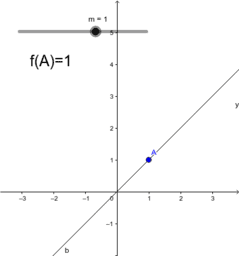
Example 1
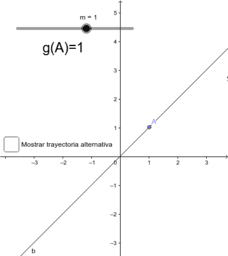
Example 2
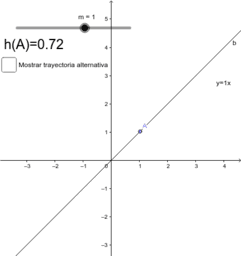
Example 3
Polar coordinates: Example 1
Polar coordinates: Example 2
Polar coordinates: Example 3
Thank you very much
Visualization of limits of functions of two variables
Author:
Laura del Río
Topic:
Functions
,
Limits
Presentation for sharing at the GeoGebra Global Gathering 2017
Introduction
Example 1
Example 2
Example 3
Polar coordinates: Example 1
Polar coordinates: Example 2
Polar coordinates: Example 3
Thank you very much
Next
Introduction
New Resources
Icosahedron1
Icosahedron
Explore the invariant lines of matrix {{-2,5},{6,-9}}
Blancmange curve (fractal)
Exploring the Derivative of a Quadratic Function
Discover Resources
Transposing Functions
Quadrilaterals Exterior(360)
MODUL 13B_JUMINI_MTsN 5 BOJONEGORO
Circumcentre and circumcircle
Steel Coupon Test Random
Discover Topics
Polynomial Functions
Quadratic Equations
Frequency Distribution
Logarithmic Functions
Trapezoid