Google Classroom
GeoGebra
GeoGebra Classroom
Sign in
Search
Google Classroom
GeoGebra
GeoGebra Classroom
Outline
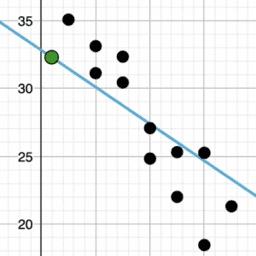
Describing Trends in Scatter Plots: IM 8.6.5
Lesson 8.6.5
Practice 8.6.5
Describing Trends in Scatter Plots: IM 8.6.5
Author:
GeoGebra Classroom Activities
,
IM 6 – 8 Math
Topic:
Algebra
,
Correlation
,
Equations
,
Linear Equations
,
Linear Regression
,
Scatter Plot
,
Statistics
“Describing Trends in Scatter Plots”
from IM Grade 8 by
Open Up Resources
and Illustrative Mathematics. Licensed under the
Creative Commons Attribution 4.0 license
.
Table of Contents
Lesson 8.6.5
IM 8.6.5 Lesson: Describing Trends in Scatter Plots
Practice 8.6.5
IM 8.6.5 Practice: Describing Trends in Scatter Plots
Next
IM 8.6.5 Lesson: Describing Trends in Scatter Plots
New Resources
Poorly Drawn Parallelograms 3
Tutorial: Create lists of numbers and objects
Poorly Drawn Parallelograms
Quiz: Finding Average Rate of Change
Icosahedron1
Discover Resources
Linear Flow on Torus
factorise
Forum_28151_B
Nets
مثال 1 الدرس 8 عاشر
Discover Topics
Fractions
Geometry
Limits
Vectors 2D (Two-Dimensional)
Pyramid